
Overall School Funding (The Last Decade)
| School Year | Total Public Education Spending | % Increase | Per Student Spending | % Increase |
|---|---|---|---|---|
| 2014-15 | $60,386,702,350 | - | $11,590 | - |
| 2015-16 | $64,061,068,212 | 6.08% | $12,130 | 4.66% |
| 2016-17 | $67,475,719,295 | 5.33% | $12,634 | 4.15% |
| 2017-18 | $69,252,688,668 | 2.63% | $12,861 | 1.80% |
| 2018-19 | $70,993,369,584 | 2.51% | $13,108 | 1.92% |
| 2019-20 | $77,019,760,233 | 8.49% | $14,058 | 7.25% |
| 2020-21 | $79,294,505,532 | 2.95% | $14,797 | 5.26% |
| 2021-22 | $84,854,165,916 | 7.01% | $15,708 | 6.16% |
| 2022-23 | $92,414,047,078 | 8.91% | $16,792 | 6.90% |
| Overall % Change | 53.04% | 44.88% |
Source(s): Texas Education Agency (TEA) PEIMS District Financial Actual Reports, Grand Total: Operating and Non-Operating Expenditures by Object
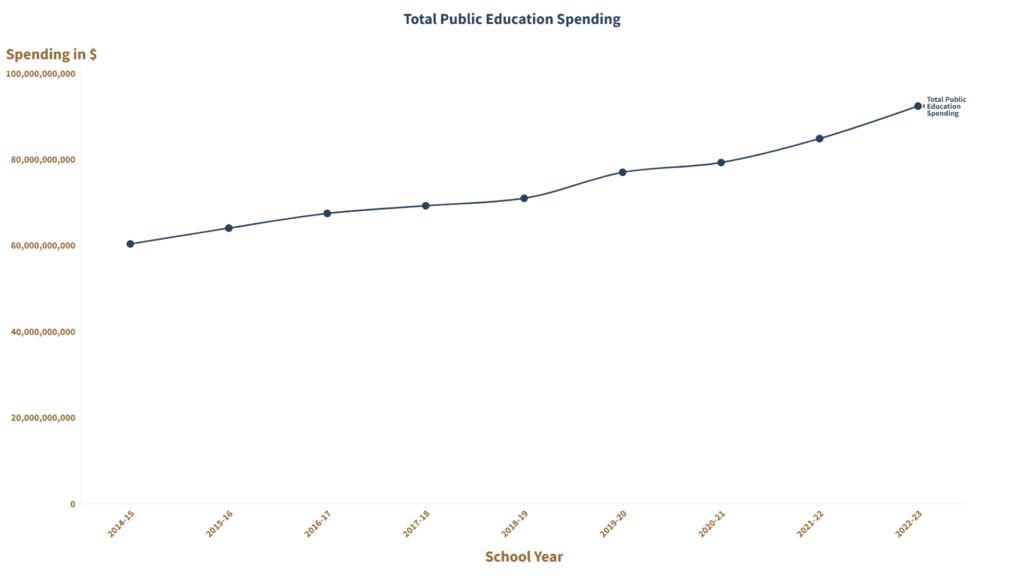
Total Public Education Spending has increased every year for the past decade. In total, it has increased over 53% since the 2014-15 school year.
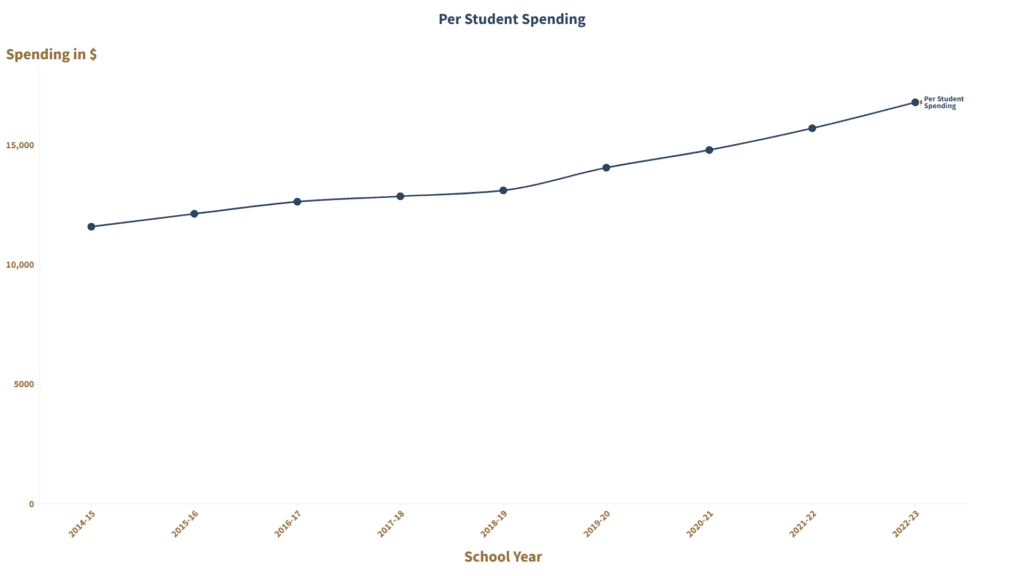
Per-student spending has increased every year for the past decade. In total, it has increased nearly 45% since the 2014-15 school year.
Students, Teachers, Support Staff, and Administrative Staff Comparisons
Growth of Student Enrollment vs. Teachers vs. Administration & Support Staff
| School Year | Total Students | % Increase | Total Teachers (FTE) | % Increase | Total Support Staff | % Increase | Total Administrative Staff | % Increase | Teacher % of Total Staff |
|---|---|---|---|---|---|---|---|---|---|
| 2014-15 | 5,232,065 | - | 342,257 | - | 66,076 | - | 26,800 | - | 50.74% |
| 2015-16 | 5,299,728 | 1.29% | 347,328 | 1.48% | 68,699 | 3.97% | 27,627 | 3.09% | 50.37% |
| 2016-17 | 5,359,127 | 1.12% | 352,808 | 1.58% | 71,342 | 3.85% | 28,214 | 2.12% | 49.95% |
| 2017-18 | 5,385,012 | 0.48% | 356,909 | 1.16% | 70,570 | -1.08% | 29,648 | 5.08% | 50.03% |
| 2018-19 | 5,416,400 | 0.58% | 358,525 | 0.45% | 73,737 | 4.49% | 30,194 | 1.84% | 49.73% |
| 2019-20 | 5,479,173 | 1.16% | 363,185 | 1.30% | 75,649 | 2.59% | 30,420 | 0.75% | 49.33% |
| 2020-21 | 5,359,040 | -2.19% | 369,461 | 1.73% | 79,742 | 5.41% | 31,151 | 2.40% | 49.47% |
| 2021-22 | 5,402,928 | 0.82% | 369,762 | 0.08% | 83,614 | 4.86% | 30,859 | -0.94% | 49.08% |
| 2022-23 | 5,518,432 | 2.14% | 371,802 | 0.55% | 83,889 | 0.33% | 34,912 | 13.13% | 48.58% |
| Overall % Change | 5.47% | 8.63% | 26.96% | 30.27% |
Source(s): Texas Education Agency (TEA) Student Enrollment Reports and Staff FTE Counts and Salary Reports
Teaching Staff vs. Administrative Staff Salaries
| School Year | Average Teacher Base Pay | % Increase | Average Administrative Staff Base Pay | % Increase |
|---|---|---|---|---|
| 2014-15 | $50,715 | - | $80,214 | - |
| 2015-16 | $51,892 | 2.32% | $81,905 | 2.11% |
| 2016-17 | $52,525 | 1.22% | $82,946 | 1.27% |
| 2017-18 | $53,334 | 1.54% | $84,456 | 1.82% |
| 2018-19 | $54,122 | 1.48% | $85,664 | 1.43% |
| 2019-20 | $57,091 | 5.49% | $89,629 | 4.63% |
| 2020-21 | $57,641 | 0.96% | $90,731 | 1.23% |
| 2021-22 | $58,887 | 2.16% | $92,806 | 2.29% |
| 2022-23 | $60,716 | 3.11% | $92,683 | -0.13% |
| Overall % Change | 19.72% | 15.54% |
Source: Texas Education Agency (TEA) Staff FTE Counts and Salary Reports
Student Achievement
Percentage of Students that Meet the STARR Test Standards – EOC Results
| Subject | Spring 2019 | Spring 2020 | Spring 2021 | Spring 2022 | Spring 2023 |
|---|---|---|---|---|---|
| Algebra I | 62% | COVID | 41% | 46% | 45% |
| Biology | 63% | COVID | 54% | 57% | 57% |
| English I | 49% | COVID | 50% | 48% | 54% |
| English II | 51% | COVID | 57% | 57% | 56% |
| U.S. History | 75% | COVID | 69% | 71% | 71% |
Source: Texas Education Agency (TEA) Statewide Summary Reports and 2022-2023 STARR EOC Analysis
*The STARR test was redesigned between 2022 and 2023.
Percentage of Students that Meet the STARR Test Standards – Reading & Language Arts (RLA)
| Grade | Spring 2019 | Spring 2020 | Spring 2021 | Spring 2022 | Spring 2023 |
|---|---|---|---|---|---|
| 3rd | 43% | COVID | 37% | 50% | 48% |
| 4th | 43% | COVID | 35% | 52% | 46% |
| 5th | 51% | COVID | 45% | 56% | 55% |
| 6th | 35% | COVID | 31% | 42% | 50% |
| 7th | 47% | COVID | 44% | 54% | 52% |
| 8th | 53% | COVID | 45% | 56% | 56% |
Source: Texas Education Agency (TEA) 2022-2023 STARR Results Analysis
*The STARR test was redesigned between 2022 and 2023.
Percentage of Students that Meet the STARR Test Standards – Math
| Grade | Spring 2019 | Spring 2020 | Spring 2021 | Spring 2022 | Spring 2023 |
|---|---|---|---|---|---|
| 3rd | 47% | COVID | 29% | 41% | 43% |
| 4th | 46% | COVID | 34% | 41% | 46% |
| 5th | 55% | COVID | 42% | 46% | 49% |
| 6th | 45% | COVID | 34% | 37% | 37% |
| 7th | 41% | COVID | 25% | 29% | 35% |
| 8th | 55% | COVID | 35% | 38% | 44% |
Source: Texas Education Agency (TEA) 2022-2023 STARR Results Analysis
*The STARR test was redesigned between 2022 and 2023.
Percentage of Students that Meet the STARR Test Standards – Science & Social Studies
| Grade & Subject | Spring 2019 | Spring 2020 | Spring 2021 | Spring 2022 | Spring 2023 |
|---|---|---|---|---|---|
| 5th Science | 47% | COVID | 29% | 37% | 34% |
| 8th Science | 49% | COVID | 42% | 43% | 45% |
| 8th Social Studies | 35% | COVID | 27% | 29% | 31% |
Source: Texas Education Agency (TEA) 2022-2023 STARR Results Analysis
*The STARR test was redesigned between 2022 and 2023.